Volatility

Volatility is the fluctuation or 'swing' in price of an asset over a period of time.
Volatility is expressed using standard deviation; this is a statistical calculation showing how widely a range of returns varied from the average return over a particular selected period. If a fund, for example, had an average return of 5% and its standard deviation was 15%, this would mean that the range of its returns over the period had swung between +20% and -10%.
This metric is often used as a measure of risk, with volatile investments varying in value more quickly and in larger ranges than less volatile investments. This can result in the loss or gain of large percentages of the value of an asset over short time periods; this could be problematic if a sale of an asset corresponds to a negative swing in price, for example. Volatile assets, however, also provide more potential for growth.
Volatility is one of the metrics used by an adviser to construct an investment portfolio tailored to a client’s attitude to risk.
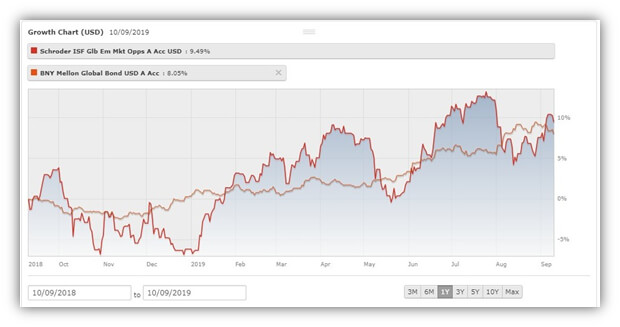
Volatility can be seen in an investments performance behaviour in a line chart, as per the below example produced from our online fund centre. The chart plots cumulative performance over a single year; the two funds have achieved similar results at the end of the year, however the Schroder fund has shown significant volatility, with large fluctuations in price. The BNY Mellon fund has grown smoothly, with smaller variance in price.
Synthetic Risk and Reward Indicator
The synthetic risk and reward indicator (SRRI) forms an integral part of the Key Investor Information Document (KIID) for UCITS funds and uses standard deviation to provide an indication of the volatility, and therefore risk, of a fund. The SRRI is expressed as a number from one to seven, with one indicating low risk and seven high.
Risk versus Reward charts
Standard deviation is also used in risk versus reward charts, plotting the performance of a fund against its volatility in a scatter chart.